
Presentation
A better knowledge of landscape dynamics provides the opportunity to focus research at different scales exploring landscapes patterns and associated systems (agriculture, forestry, etc.) from local, regional to global. The developed processes address the composition of landscapes (CP Land cover class = landscape elements/components) and their spatial configuration. They bring forward the spatial organization of the LC/LE classes and construe what this spatial structuration reveals in terms of land use planning and socio-ecological behaviors.
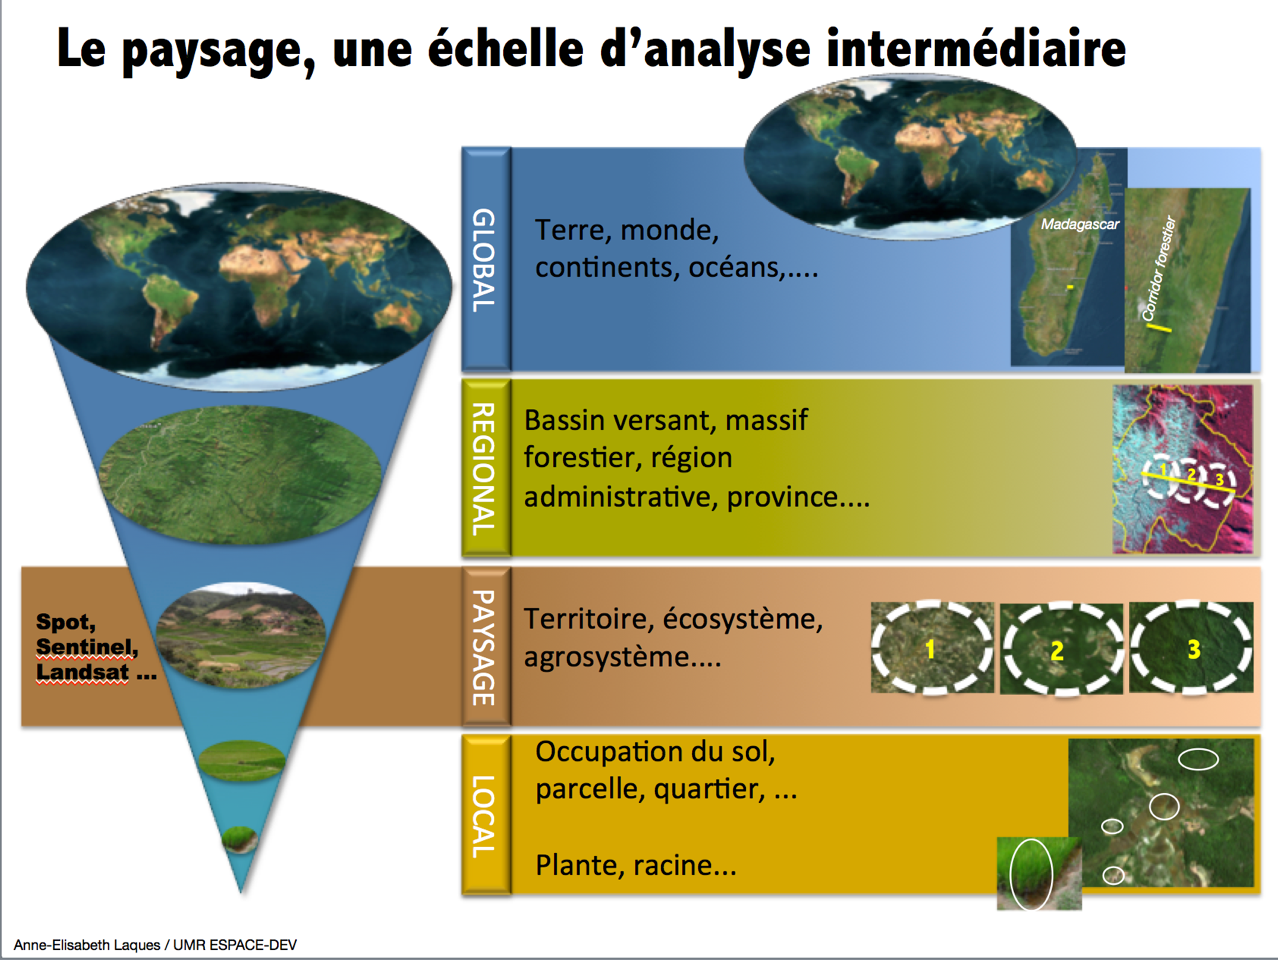
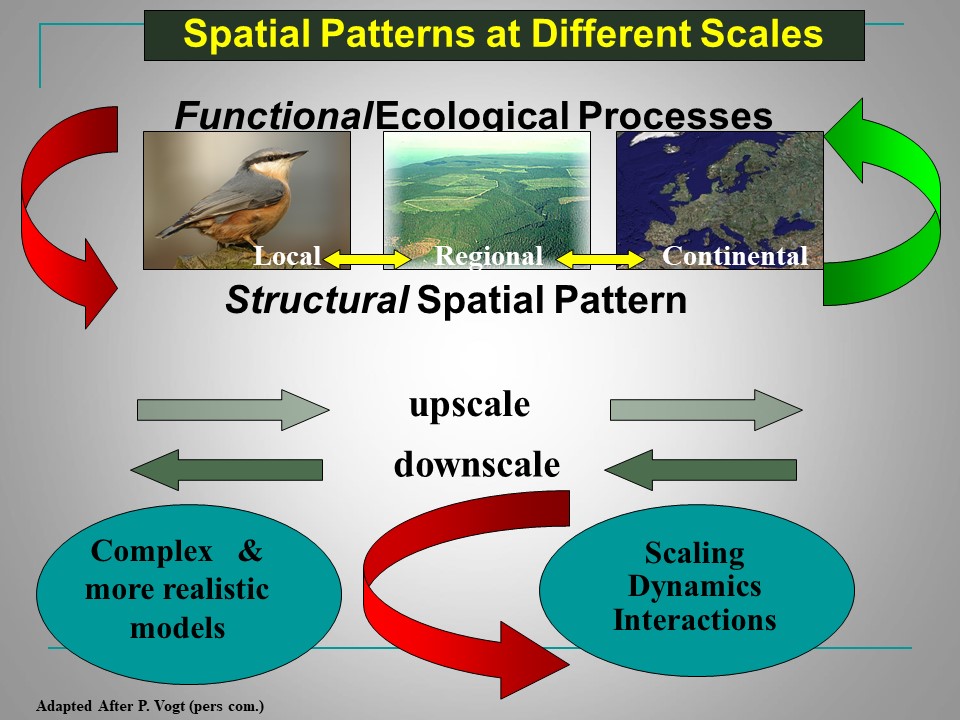
Figure: landscapes at different scales
Analyzing systems through landscape patterns recognition is vital for land use planning. It contributes, to support tools to better assess biodiversity, forest degradation. Identifies positive or negative interactions between health and environment. It helps as well to develop a better monitoring and assessment of the impact of public policies designed for environments and natural resource management.
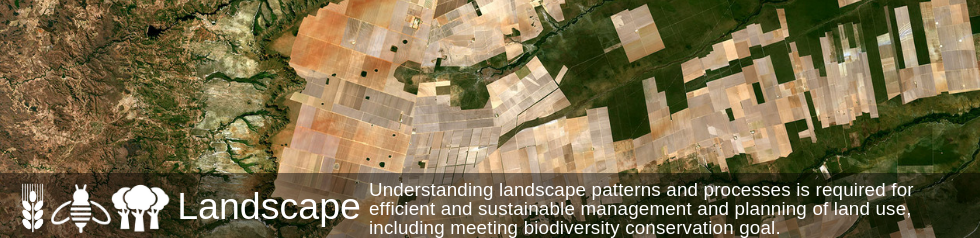
Human activities imprint landscape structure, in particularly at the so called intermediate scales. Consciously or not, they modify the composition and configuration of existing landscapes. Understanding and analyzing landscape patterns at different scales help to unravel the processes occurring, and the impact on landscape functions that they generate. Such an understanding of landscape patterns and processes is finally required for efficient and sustainable management and planning of land use, including meeting biodiversity conservation goal.
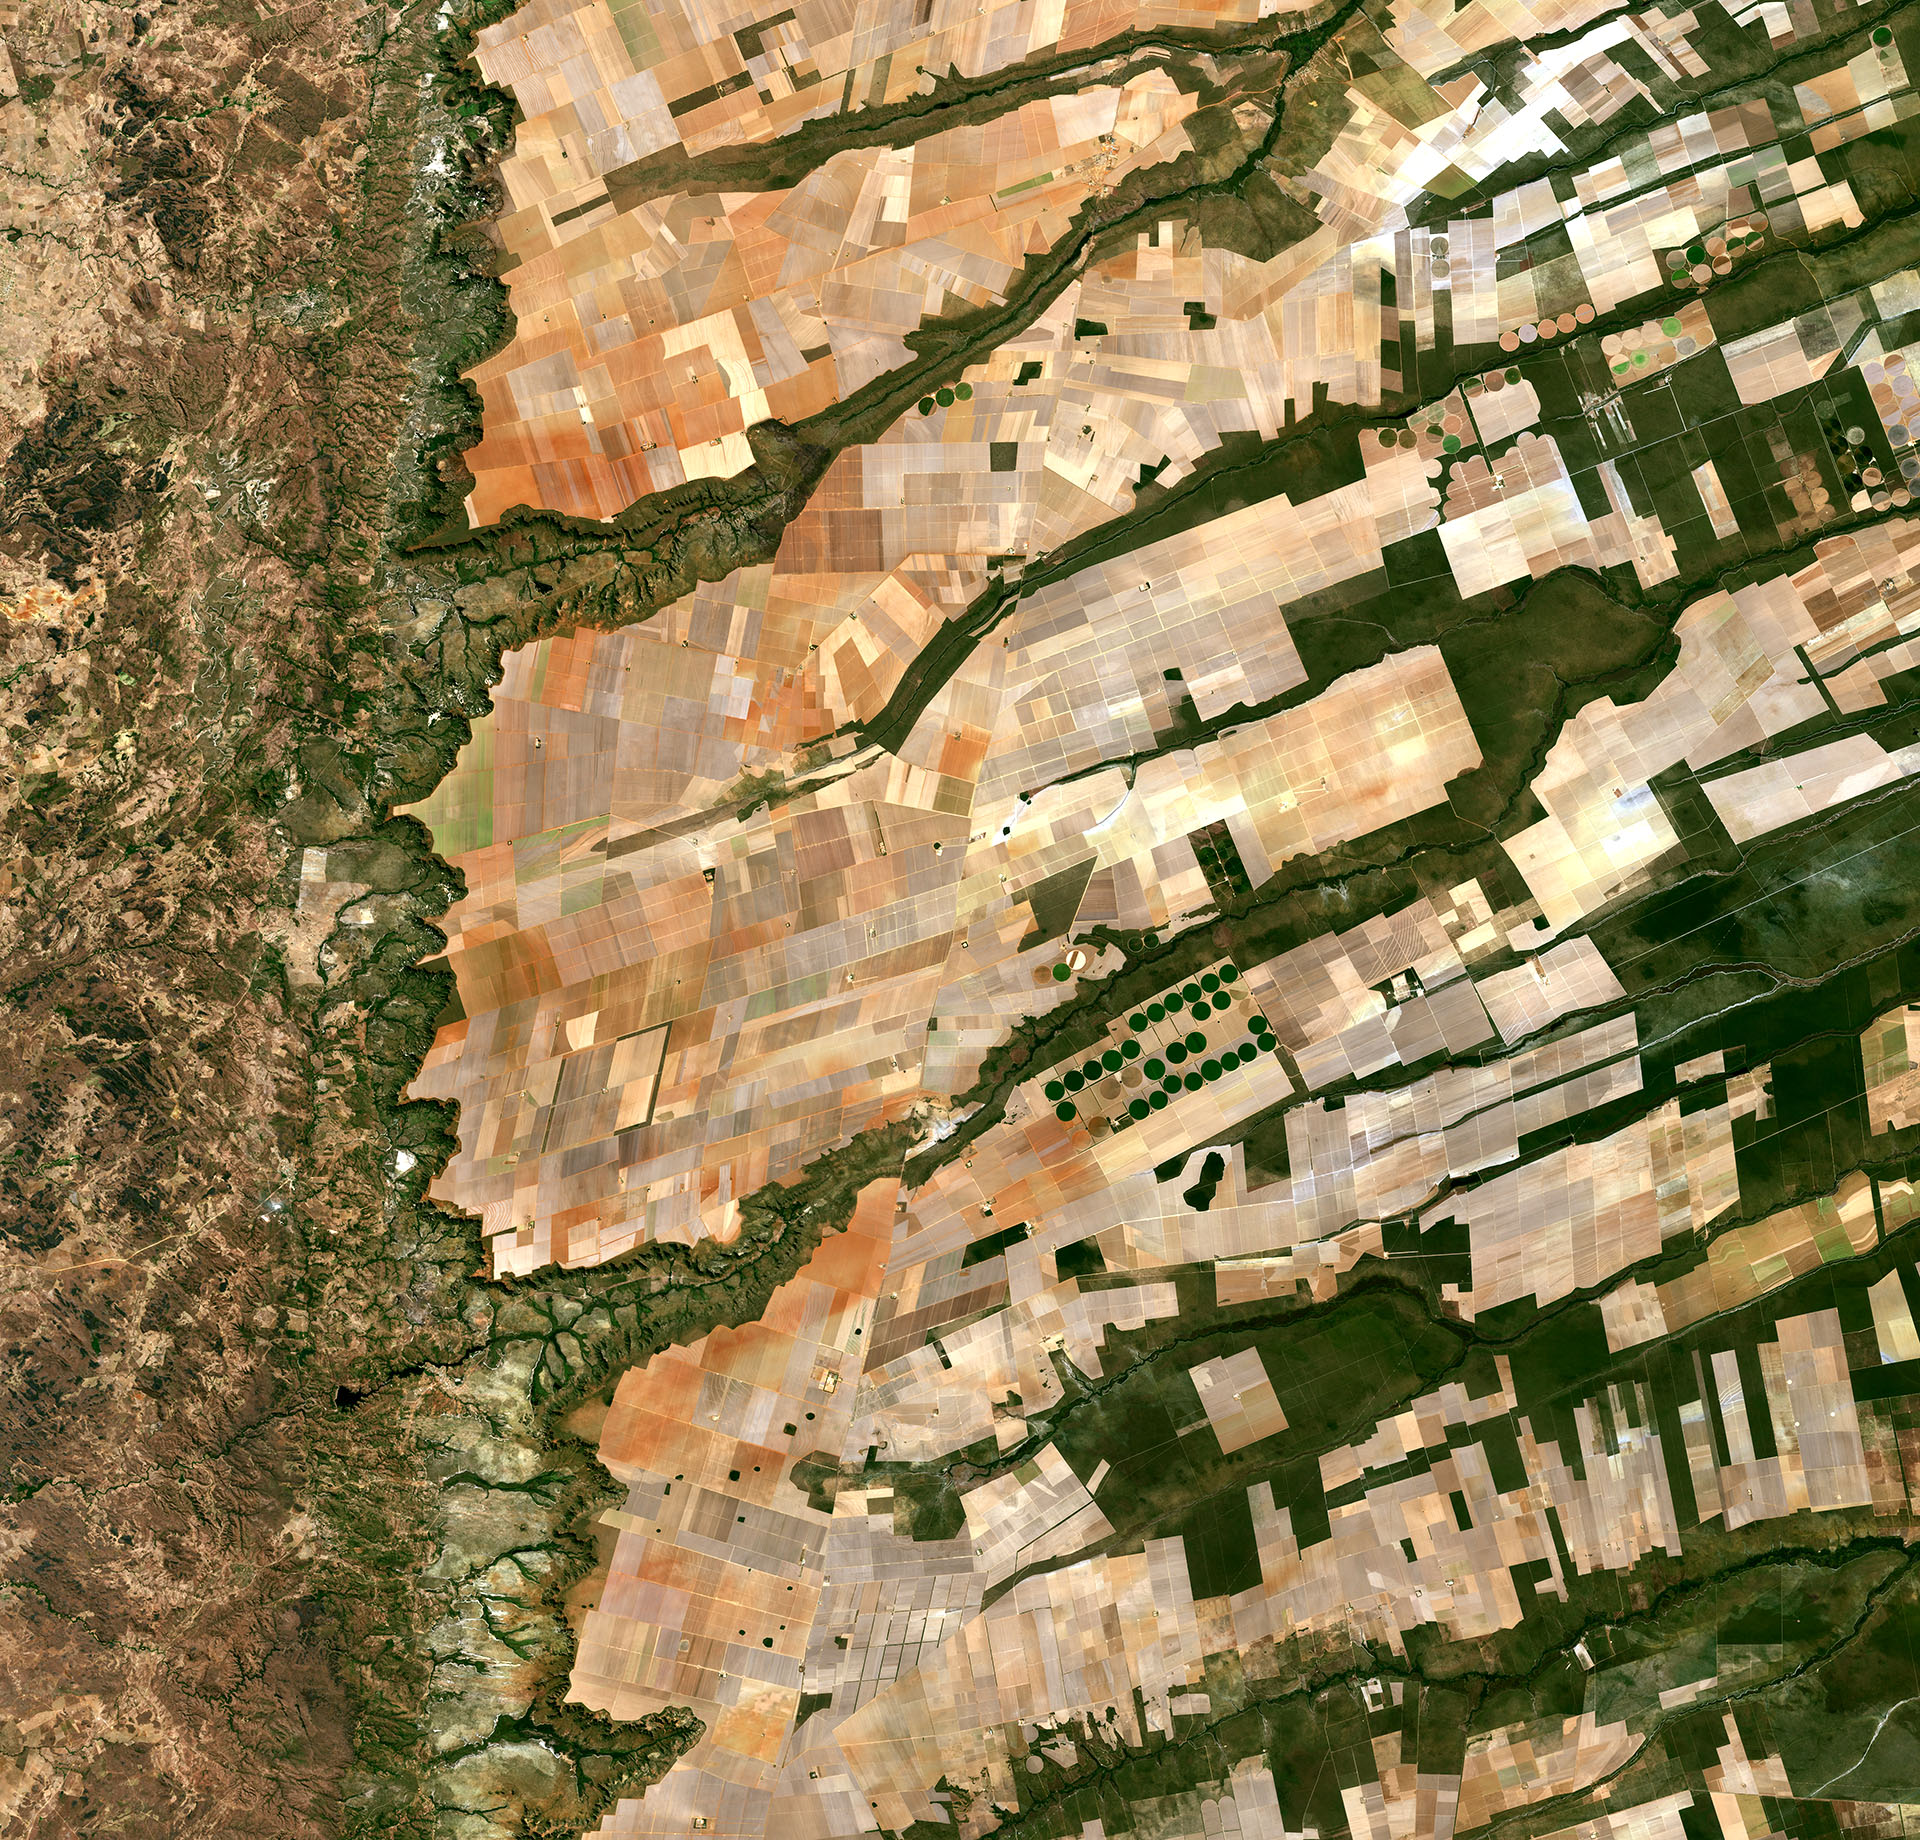
Central-eastern Brazil (where the Bahia, Tocantins and Goiás States meet) modified Copernicus Sentinel-2A data (2016-released 2017), processed by ESA
Here we can see a large, flat plateau blanked with fields benefiting from rich soils and an apparent abundance of water, before falling off into a green, hilly valley (left). The straight lines in the image are roads, such as the highway running in a nearly straight line from the centre-top to bottom of the image. The area is particularly known for soybean production. The country’s soybean output has increased by more than 300% since the 1970s.
Landscape as a tool for land use knowledge and management
The Scientific Expertise Centre (SEC) mission is to coordinate actions concerning the use of images and by-products in order to:
- Improve the detection of landscape zonings
- Identify diversity of landscape patterns to support land use management.
- Identify indicators including landscape metrics at various scales: These different indicators help to i) estimate the impact of land management policies, notably in terms of biodiversity conservation; ii) enhance particularly the inclusion of corridors, of Blue and Green infrastructures; iii) support monitoring of forest fragmentation as well as the alteration of natural habitats.
For this purpose, the SEC will focus on the following goals and deliverables:
- Phase 1: feedback analysis in order to select :
- Pertinent methods (already used and implemented by several research teams) for a characterization of landscapes and coherent functional units by remote-sensing
- Test and develop spatially explicit indicators to monitor the state of resources, the impacts of agricultural and forestry practices and public policies, degree of degradation.
This first phase will focus on Land Use processes combining images, modeling and by-products
- Phase 2: developing of new processes and of Deep Learning treatments
- By-products will be designed to answer the demands formulated by managers already involved in projects carried by our associated teams.
Project deliverables:
- Landscape standardized identification methods combining images and by-products (OS) in collaboration with the OSO CES
- Automatically updated landscape and functional units mapping
- Algorithms and indicators for landscape measurement (forest degradation index, fragmentation, heterogeneity)
- Thematic mapping of indicators (forest degradation, environmental vulnerability, afforestation, habitat connectivity, etc.)
Contact

Anne-Elisabeth Laque
UMR « Espace Dev »
Research Gate
@Anne-Elisabeth.Laque
Contributions

Sandra Luques
INRAE |TETIS
Research Gate
@sandra.luques
Contributions