Data access
Presentation
The POLDER-2 BRDF data base compiles 24,090 BRDFs acquired by ADEOS-2/POLDER-2 from April ro October 2003, on a maximum number of sites describing the natural variability of continental ecosystems, at several seasons whenever possible. The POLDER-2 bidirectional reflectances have been corrected from atmospheric effects using the advanced Level 2 algorithms described on the CNES scientific Web site. The BRDF database has been implemented on the basis of the 22 vegetation classes of the GLC2000 land cover map
In any publication using the POLDER-2/ADEOS-2 BRDF database, please include the following quotation : « The POLDER-2 BRDF database Issue 1.00 has been produced by POSTEL. The data are from CNES POLDER-2 onboard NASDA ADEOS-2. » . »
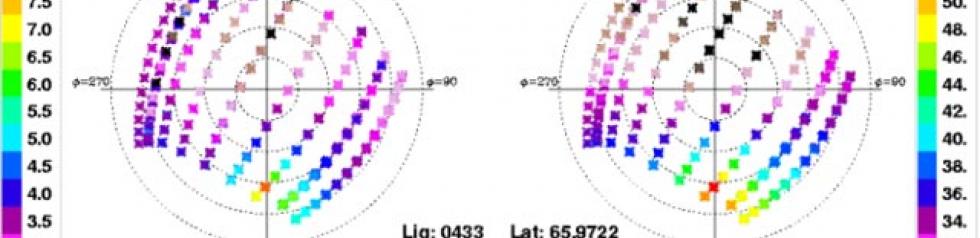
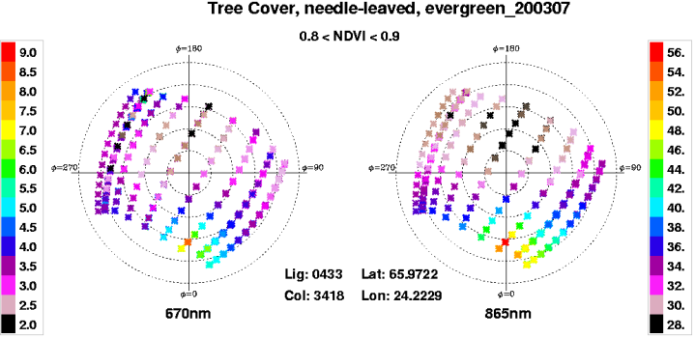
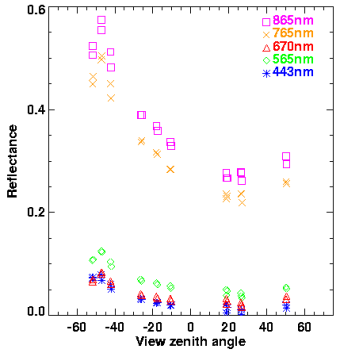
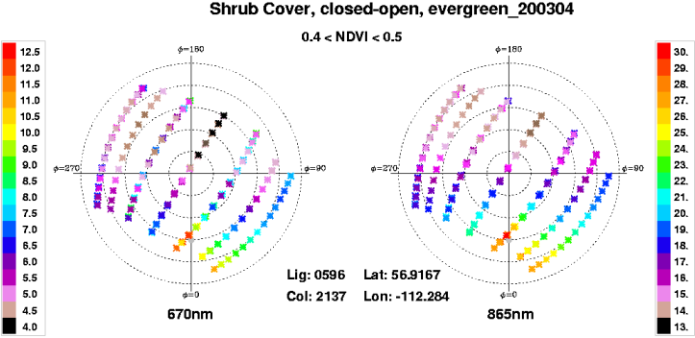
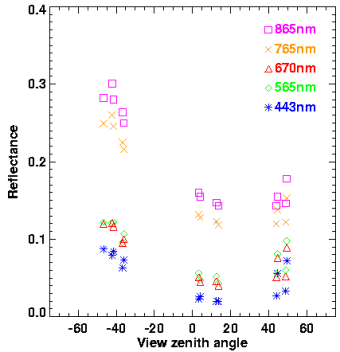
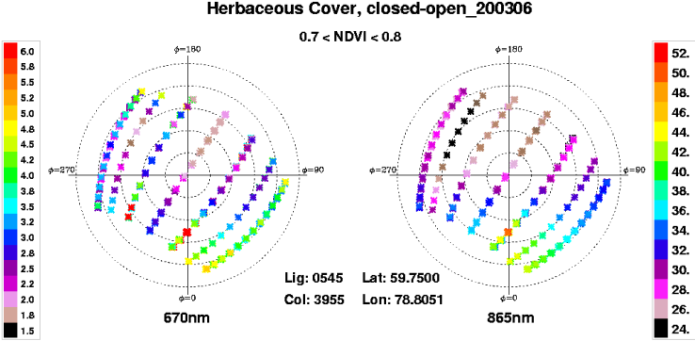
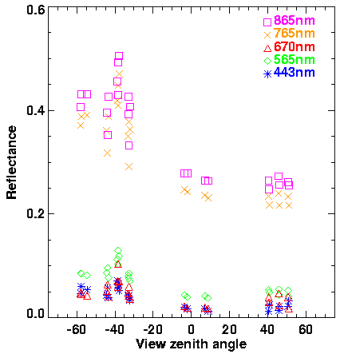
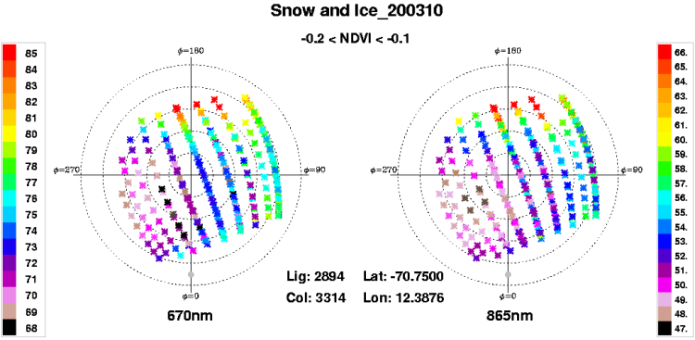
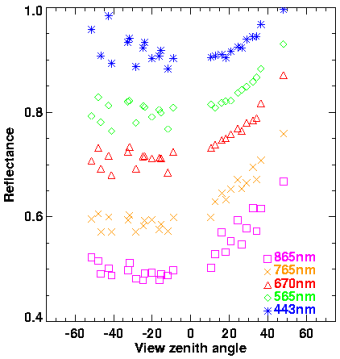
The figures below present BRDFs of 4 various ecosystems acquired at different periods of 2003 : the bi-directional reflectances (%) at 670 nm (left) and 865 nm (right) are represented in the angular space. The major features of the BRDF are a peak of reflectance when the sun and the viewing directions coincide (the hot spot effect) and a minimum of reflectance in the forward scattering direction. These patterns are clearly displayed on the data collected in the principal plane (bottom). The BRDF of snow displays well distinct spectral profiles, with reflectances at 670nm larger than near-infrared reflectances. The specific bowl shape shows an increase of reflectance in the forward direction, which translates the presence of a thin water layer at the surface.
The directional profiles are strongly marked by the POLDER-2/ADEOS-2 short cycle (4 days). The scattering of reflectances for a given viewing configuration translates the variation of surface state during the synthesis period. The pixels below are quite stable over one month. The impact of changes in illumination angles can be neglected, except around the hot spot direction where the variations of reflectances are maxima.
Format
A user manual presents the algorithm of construction of the data base, analyses the BRDFs and describes the file format. The Visu_BRDF_POLDER software, developed by LSCE, allows to visualize the BRDF data base, to test 6 BRDF models, linear or non-linear, and to compare the results of model inversion with the measurements.