Data Access
Description
At the end of 2022, the SWOT satellite (NASA-CNES) will enable global monitoring of water resources on continental surfaces. Its two radar antennas and interferometric processing capabilities will enable it to measure variations in surface area and height on a single instrument. This information will be used to estimate river flows and variations in the volume of water in lakes and reservoirs around the world.
To support, calibrate and validate this ground-breaking mission, CNES has developed a water surface detection chain based on measurements from the Copernicus Sentinel-1 and 2 satellites. The system is called Surfwater.
Surfwater indicates the presence or absence of open water on continental surfaces. New maps are produced every five days in the absence of clouds for optical observations and every three days on average in Europe for radar observations. They are generated from Sentinel-2 level 2A images produced by Theia and Sentinel-1 images broadcast by PEPS. Monthly and annual summaries are also available for seasonal and climatic studies.
A dataset of annual and monthly optical water summaries for mainland France in 2022 has been published on Thisme. The continuous production of these optical products began at the end of 2023 on hydroweb.next. Radar products, enabling acquisitions at night and in cloudy areas, should be available in 2024.
Data and Methods
Surfwater uses two types of satellite observations as input:
- Ortho rectified optical images (Sentinel-2 – L2A), expressed in surface reflectance and accompanied by a cloud mask. These observations are revisited every 5 days and are subject to the presence of clouds.
- Radar images (Sentinel-1) with an orbit repeatability of 6 days, compensated for by a greater number of observations than optical images thanks to day and night passes, and without the risk of interference from clouds. For reasons of throughput, observations every 6 days are limited to Europe and a few privileged areas. Outside Europe, observations every 12 days will be used.
The detection method, adapted for each observation, is based on RandomForest learning from the permanent waters present in Global Surface Water [doi:10.1038/nature20584 ]. Surfwater uses radar backscatter or optical reflectance/index information for classification [https://doi.org/10.3390/rs13163279].
For these methods, a flood potential map is used to delimit exclusion zones for water surfaces in order to limit false detections. This map is based on the MERIT DTM [doi: 10.1002/2017GL072874] and the relative height of each zone with respect to its corresponding drainage line (HAND – Height above neirest drainage).
Surfwater then automatically processes this data to provide the following output:
- Instantaneous water masks, created from each optical or radar observation at 10m resolution. If an optical image shows clouds, the map will contain zero values (Nodata) over the areas concerned;
- Combined water masks, using data from the last 15 days;
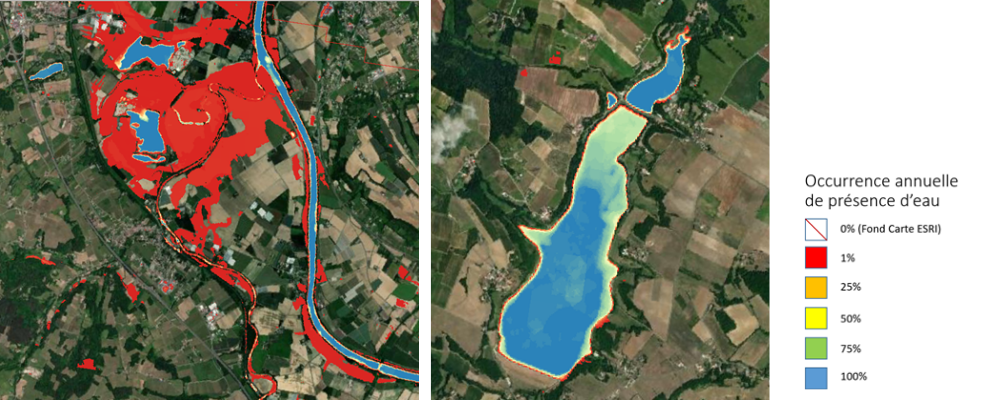
- Monthly summaries, representing the ratio between the number of times a pixel has been observed in water and the number of observations for the month;
- Annual summaries, representing the ratio between the number of times a pixel has been observed in water and the number of observations for the year.
Contact

Santiago Peña-Luque
CNES
@S.Peña-Luque
Reference publication
Peña-Luque, S.; Ferrant, S.; Cordeiro, M.C.R.; Ledauphin, T.; Maxant, J.; Martinez, J.-M. Sentinel-1&2 Multitemporal Water Surface Detection Accuracies, Evaluated at Regional and Reservoirs Level. Remote Sens. 2021, 13, 3279. https://doi.org/10.3390/rs13163279 [https://doi.org/10.3390/rs13163279]
Format
The annual and monthly products supplied are in the form of a Geotiff file at 10 m resolution. Raster: these are files named SW_S2MONTHLY_TXXXX_YYYYMMDDT000000.tif
The pixels are coded as follows:
0: Water never observed among all the observations of the period (occurrence = 0%)
0 to 1: Occurrence of water detection among all the observations of the period (example: 0.34 = 34% of water detections)
1: 100% occurrence of water
255: Area never observed during the period