Data Access
Summary
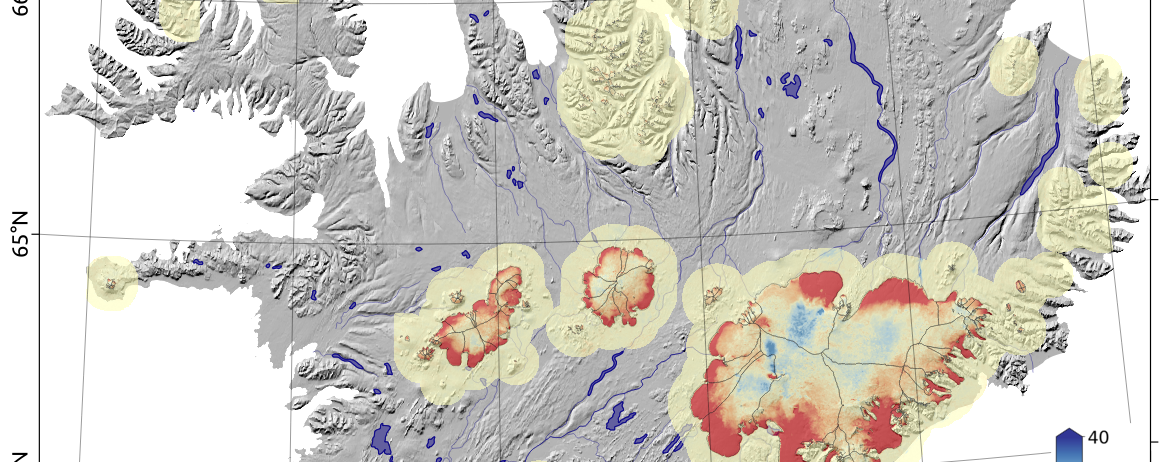
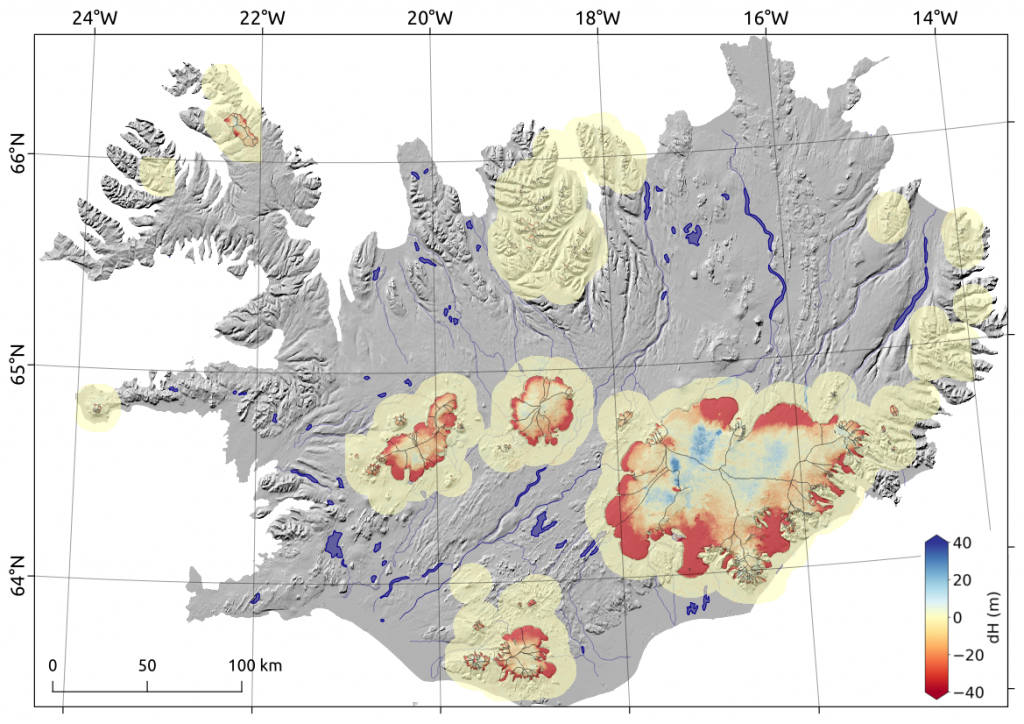
A LEGOS research team contributes to Theia Glaciers SEC with a product documenting the elevation changes of glaciers and nearby non-glaciated terrain (with 10 km) between 2000 and 2019, based on the Hugonnet et al. (2021) study. This is the first comprehensive mapping of elevation changes for the over 200,000 glaciers on Earth. This dataset allows estimating their mass balance and thus their contribution to sea level rise, their hydrological importance and to better characterize their responses to temperature and precipitation variations over the last 20 years.
Elevation changes are distributed at a horizontal resolution of 100 m x 100 m and for the 5-year periods of 2000–2004, 2005–2009, 2010–2014 and 2015–2019, the 10-year periods of 2000–2009 and 2010–2019 and the full 20-year period of 2000–2019. Periods refer to inclusive calendar years of 1st January to 1st of January (e.g., 2000–2004 is January 1, 2000 to January 1, 2005).
Data and Methods
The glaciers mapped are based on the Randolph Glacier Inventory 6.0.
The surface elevation change estimation derives from fitting Gaussian Process regression to time series of elevation observations from multiple Digital Elevation Models (DEMs).
DEMs are primarily generated and corrected from the Advanced Spaceborne Thermal Emission and Reflection Radiometer (ASTER) stereo imagery [ASTL1A].
DEMs from the archives of ArcticDEM and of the Reference Elevation Model of Antarctica, derived from WorldView and GeoEye imagery, are also used in the polar regions.
Topographic data from SPOT67, Pléiades, Lidar, ICESat and Operation Ice Bridge are used as ancillary data to evaluate the performance and assess the uncertainties.
More scientific information is available in Hugonnet et al., doi: 10.1038/s41586-021-03436-z,2021 [https://doi.org/10.1038/s41586-021-03436-z] and its supplement.
The products can be downloaded by tiles of 1° x1° and by period at maps.theia-land.fr
Bulk downloading is available at the Sedoo site of Observatoire Midi-Pyrénées.
Code and guides to manipulate the dataset at different scales are available on a dedicated GitHub repository.
Contact

Romain Hugonnnet
LEGOS
ResearchGate
@R.Hugonnet

Étienne Berthier
LEGOS
@e.berthier
ResearchGate