Presentation
THEIA group of experts in Glaciers gathers together teams IGE-Grenoble and LEGOS-Toulouse who are developing products related to glaciers and their evolution using optical spatial remote sensing.
The users are R&D (input glaciological data for the study of the climate/glacier relationship and for glacio-hydrological modelling), industry (hydropower producers) and local authorities including National Parks (monitoring glacier evolution).
The data used come from Sentinel-2, Landsat 5/8, ASTER and Spot-6/7.
Four complementary products
Altitude of Glacier equilibrium-line altitude
Theia Altitude of Glacier equilibrium-line altitude product proposed by the IGE-Grenoble team has an annual update frequency. It covers nearly 240 glaciers in the European Alps.
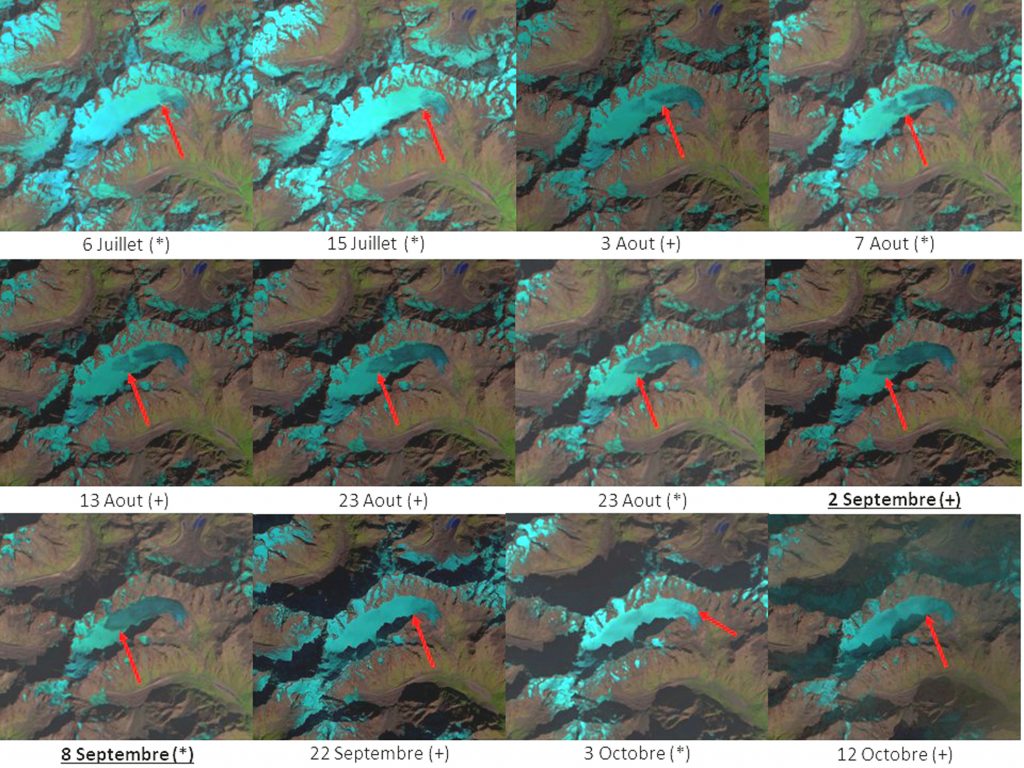
To facilitate identification of the snow line, a combination of spectral bands was used: green, near-infrared and mid-infrared showing ice in dark blue, snow in very light blue, and bedrock and vegetation in more natural colours (green and brown respectively). The images shown were acquired by the LANDSAT-8 (*) and Sentinel-2 (+) satellites. The maximum altitude reached by the snow line is used as an indicator of the altitude of the glacier equilibrium line; in this example, it is reached between September 2 and 8.
Illustration from the doctoral thesis of Lucas Davaze (2019, http://www.theses.fr/2019GREAU022)
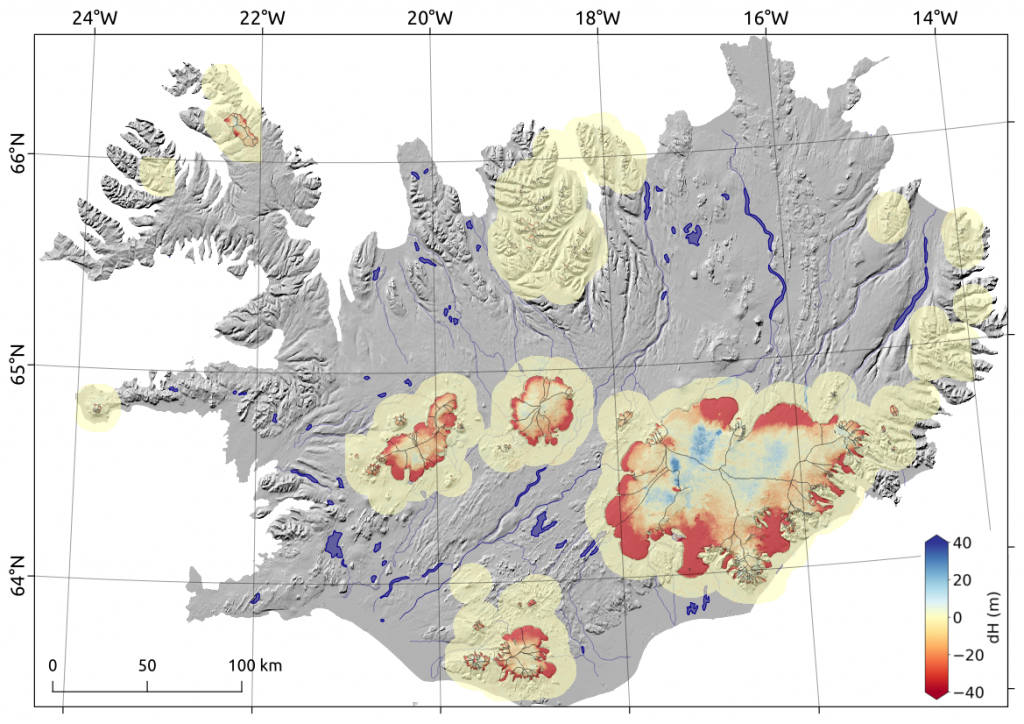
Rate of Glaciers Elevation Changes
The product Rate of Glaciers Elevation Changes (that also includes changes on the neighbouring non-glacierized terrain), developed by the LEGOS team, covers the 220,000 glaciers distributed in the different glacierized regions on Earth. Elevation changes are provided at a horizontal resolution of 100 m x 100 m, and annual rates are given for every 5-year periods: 2000-2004, 2005-2009, 2010-2014 & 2015-2019, 10-year periods: 2000-2009 & 2010-2019, and over the entire 20-year period: 2000-2019.
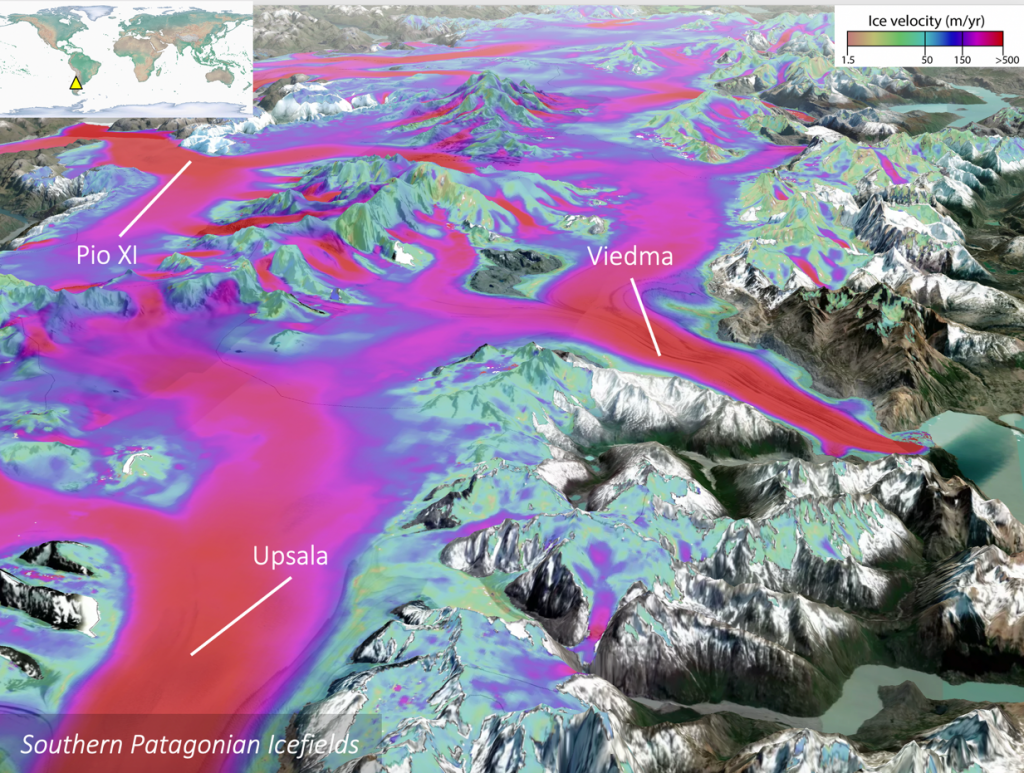
Glacier surface flow velocity
The product “glacier surface flow velocity” covers all the glaciers distributed in the different glacierized regions on Earth outside the ice sheets. Glacier surface flow velocities are provided at a horizontal resolution of 50 m and are representative of the average velocity for the period 2017-2018.
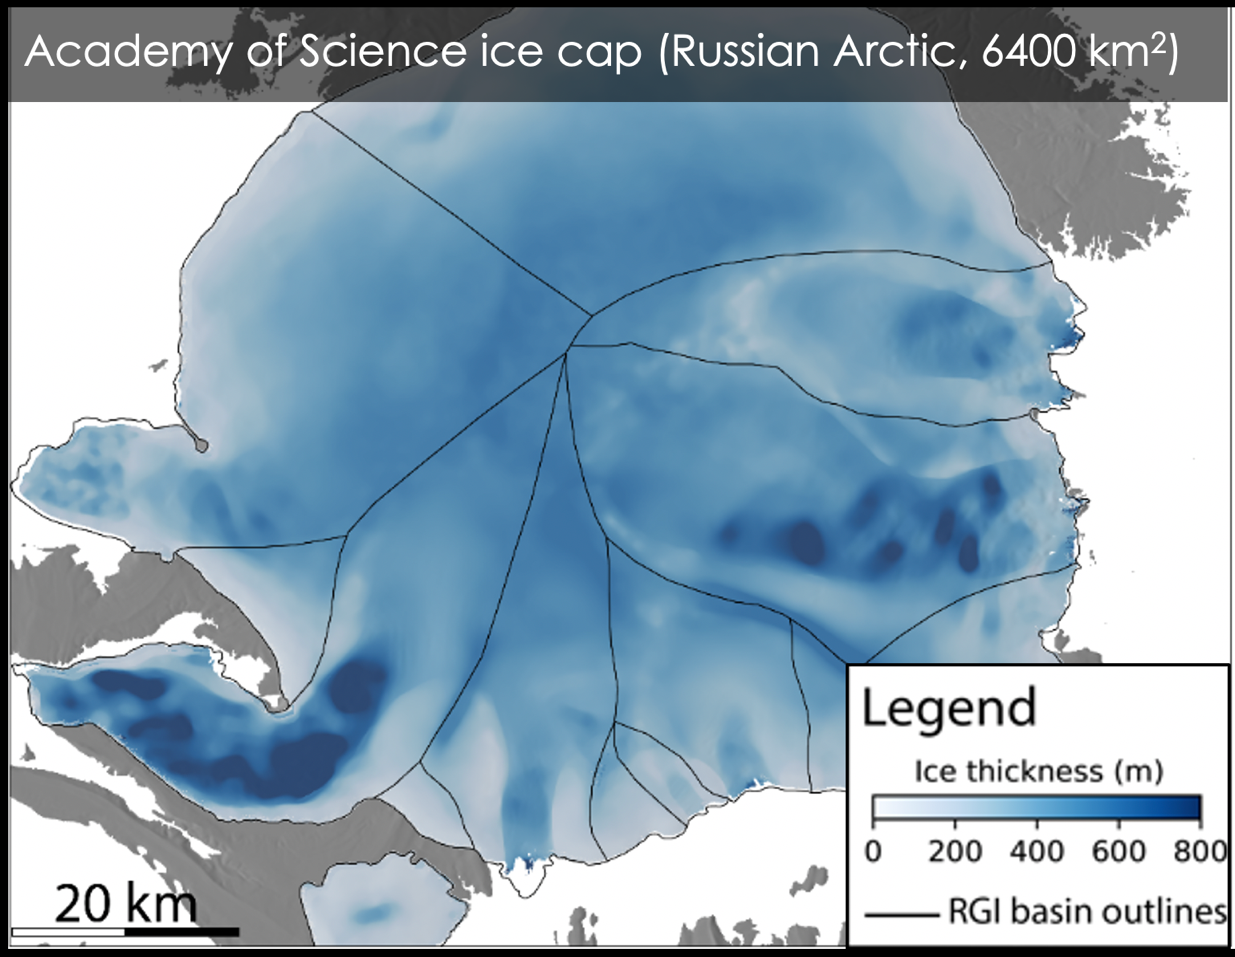
Glacier thickness distribution
The product “glacier thickness distribution” covers all the glaciers distributed in the different glacierized regions on Earth outside Greenland and Antarctica. Glacier thicknesses are estimated from the glacier surface flow velocity (cf. product “glacier surface flow velocity”) and a digital elevation model of the glaciers’ surface. Glacier thicknesses are provided at a horizontal resolution of 50 m and are representative of the decade 2010-2020.
Schedule
- 2018: finalization of the automated data processing chain and validation of the product “altitude of the annual glacier equilibrium line” for the glaciers of the French Alps for the period 2000-2016
- 2019: validation of the product on the scale of the European Alps for the period 2000-2016
- Spring – summer 2020: Availability of the product “Glacier annual equilibrium-line altitude” for 239 glaciers in the European Alps for the period 2000-2016
- Spring – summer 2021: Availability of the product “Glacier surface elevation changes » for the period 2000-2019 and every 5-yr and 10-yr sub-periods.
- Winter 2021-22: Availability of the product “Glacier surface flow velocity” for the period 2017-2018.
- Winter 2021-22: Availability of the product “Glacier thickness distribution”.
Contact


Étienne Berthier
LEGOS
@e.berthier
ResearchGate