A World Glacier Atlas to understand glacier mechanisms in a global warming context
Universal monitoring of glaciers thanks to satellites
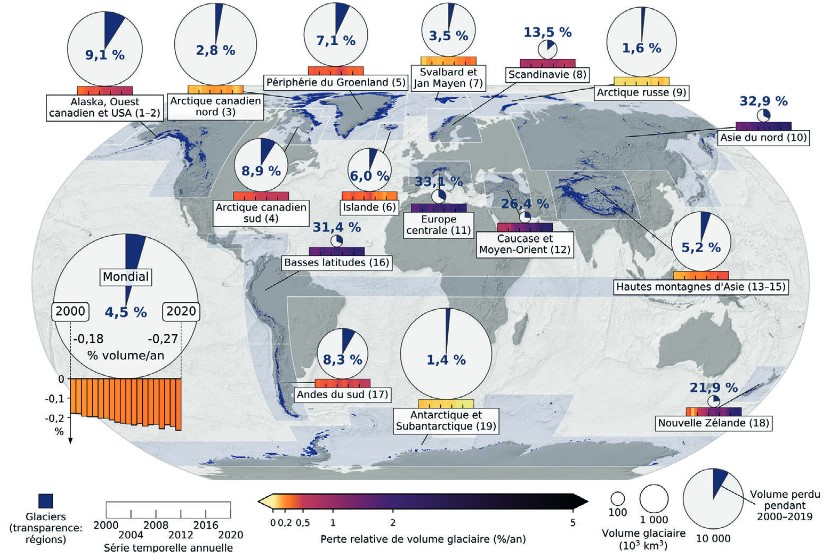
In just a few years, we have gone from a world in which only a few glaciers were monitored in the field to a global atlas of their speeds, thicknesses and changes, deduced from satellite data. Through modelling, the possibility of adding new estimates of glacier thickness has changed the situation. Combined by R. Hugonnet, R. Millan, J. Mouginot, A. Rabatel and E. Berthier in their work, these new data reveal for the first time the relative speed of glacier mass loss.
In just 20 years, some regions, such as the European Alps, have lost a third of their ice volume. These results should be a wake-up call to the public and to decision-makers, given the speed of these changes and the major societal impacts they will have.
Data access
In the interests of open science and data sharing, the French scientific community has set up national data centres within the Data Terra national research infrastructure. The products presented in this article are therefore accessible without restriction via CES Glaciers.
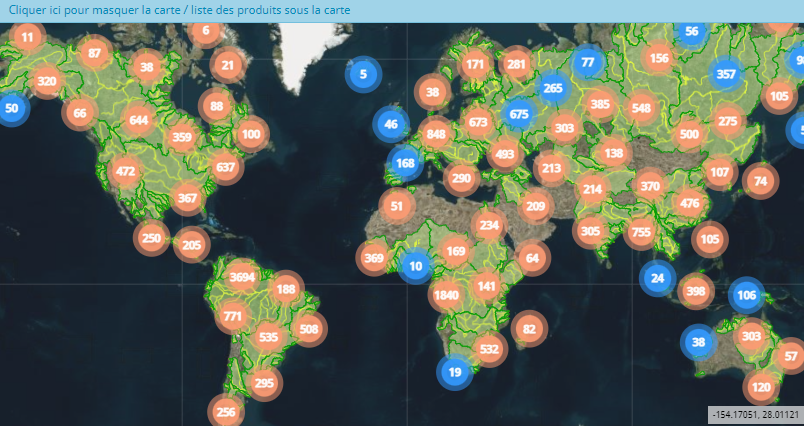
They can be downloaded either in bulk via ftp, or in tiles via a map interface that displays the different datasets.
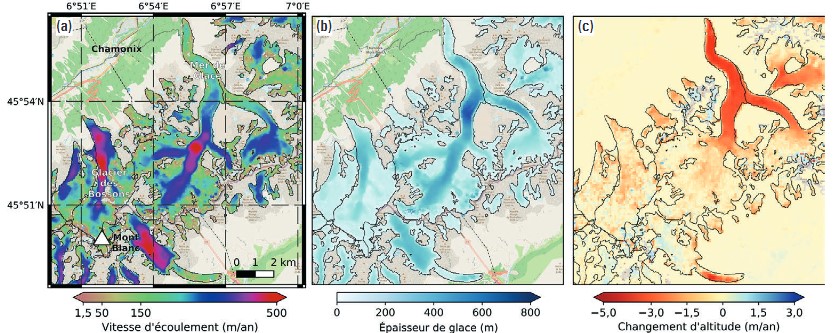
(a) surface flow velocity, mean 2017-2018, (b) ice thicknesses and (c) change in surface altitude for the period 2000-2019.

Étienne Berthier
LEGOS
@e.berthier
ResearchGate