Monitoring of Land Soil Sealing by Remote-Sensing
Monitoring land use has become increasingly important over the last decade. Regulations, political objectives, planning and development documents regularly reinforce the importance of measuring and monitoring land use and its operational implementation.
There are many avenues of research and they are part of a panorama of multiple methods and reference databases pending a forthcoming ‘standardisation’, starting with a shared official definition of soil sealing : identifying and finely measuring the evolution of artificialisation, but also reducing production times and
facilitating reproducibility over time, among other things.
Numerous research projects, notably within the framework of Theia Urban Scientific Expertise Center (SEC), aim to develop or consolidate new methods and products that contribute to the measurement and qualification of soil sealing.
Contributing to the measurement and characterization of artificialisation
In 2007, UMR TETIS was asked by Languedoc-Roussillon regional authorities to work on this issue and to propose a regional method for mapping and quantifying artificial areas that could be generalised and reproduced over time. Based on the use of satellite images (Rapid Eye, IRS) and custom processing, this cartography required more than 25 days of processing / post-processing to cover only a part of the targeted territory.
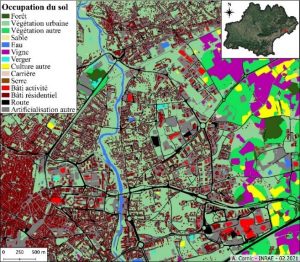
In 2018, this work was continued and extended to the scale of the new Occitanie Region (13 departments, ~ 72,000 km²) within the framework of a “Research and Society” call for projects (Occitanie Region/ ERDF). The new methodology based on artificial intelligence and Spot 6/7 images (made available within the framework of GEOSUD / DINAMIS) has made it possible to automate the process and thus reduce the human time required for its implementation (~10 days of processing without human intervention to process the 13 departments). Figures 1 and 2 below illustrate the results of this work: automated extraction of buildings by distinguishing between residential and business use, and an intermediate product of simplified land use.
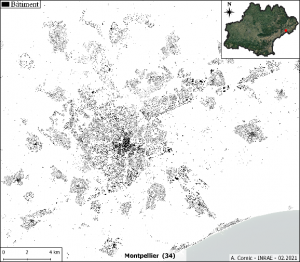
Mapping the buildings
The mapping of buildings was carried out over five consecutive years, from 2015 to 2019. It distinguishes between residential and industrial and commercial uses. This product was evaluated using two approaches:
○ a first, classical approach, based on the number of certified pixels;
○ a second, object-oriented approach, which focuses on the detected objects (contiguous pixels belonging to the same class). This approach made it possible to qualify both the geometric and planimetric accuracy of the predicted features with respect to the training set and to determine a minimum mapping unit (MMU) for the “building” class, which is of the order of 100 m².
The spatialization of these assessments also revealed a better detection of buildings in continuous urban fabric (according to the Corine Land Cover nomenclature). In peri-urban and rural areas, it seems that the trained models are less efficient, perhaps due to the very different contexts around diffuse or isolated
buildings.
The intermediate land use product was refined by spatial analysis (distinction between rural and urban vegetation, for example) and structured with the addition of the IGN road network. The objective was to specify the constituent elements of soil sealing and to give users the possibility of arranging these elements
according to their problems and their final definition of this phenomenon.
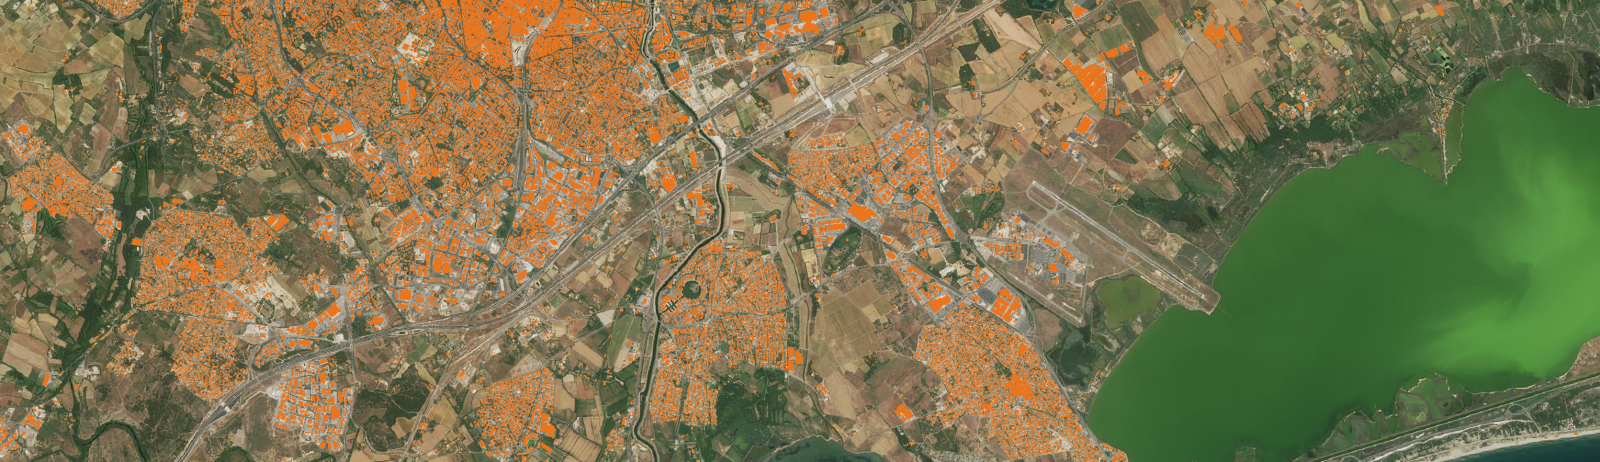
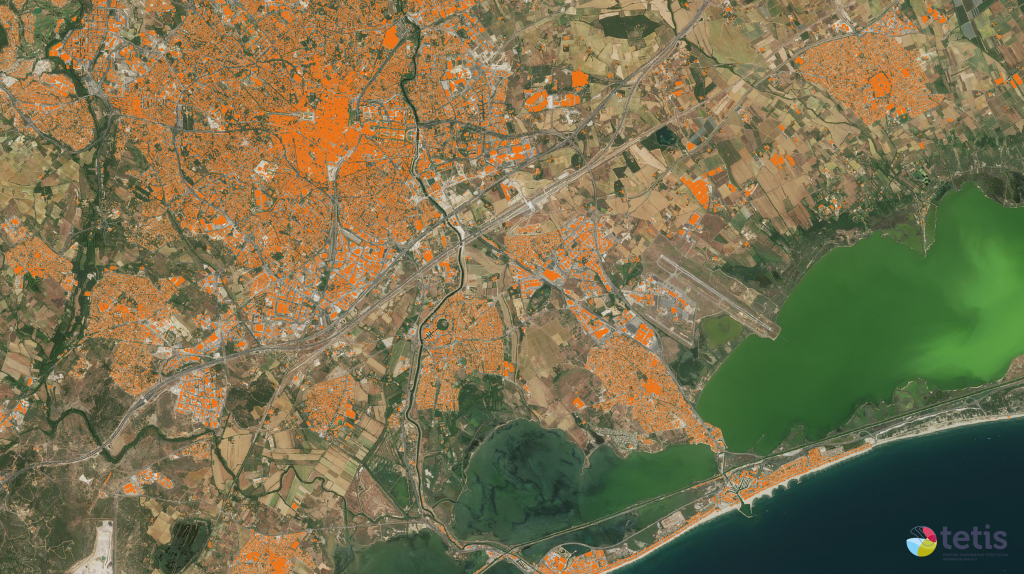
The methodology developed within the framework of the ArtiSols project was consolidated during 2021 within the framework of the TOSCA AIM-CEE project, and implemented on a national scale. Using the same method, the team used about 1200 Spot 6 and 7 images and the IGN BD TOPO to train an artificial neural network to map human constructions such as buildings, over the whole of metropolitan France. Once the model was trained, it could be applied to the entire Spot 6 and 7 images to generate maps. This product, called “Buildings Footprint”, is currently distributed by Theia Urban SEC, under an ETALAB2
licence (Figure 3, above). More information on the method and the tools used is given on the product presentation sheet: Buildings Footprint.
Data available on thisme.cines.teledetection.fr/search?collection=BuildingsFootprint&_view=map.
In its future work, the team plans to extend the product to French overseas territories and departments and to improve the performance of its method. Indeed, the limitations of current supervised learning methods lie mainly in the quality of the data: it is necessary to have ground truth data that is synchronised as
well as possible with the satellite images. The INRAE team is addressing this problem, in particular through research and development collaborations with the IGN.
Complementing land use products and databases
The research presented here contributes to improving knowledge of artificial areas. It demonstrates the value and relevance of satellite imagery for rapidly producing information at a lower cost (automated processing, low demand on human resources, compromise between swath and accuracy, availability of DINAMIS system for making annual coverage), with high frequency (annual). This information is also qualified in order to support users. These methods and products explore new avenues of production and raise research questions about the exhaustiveness and qualification of results. Provided that their limitations are taken into account, they are already complementary to reference land use products and databases.
Éric Barbe, Rémi Cresson & Kenji Osé
INRAE TETIS
Urban SEC