Data Access
Presentation
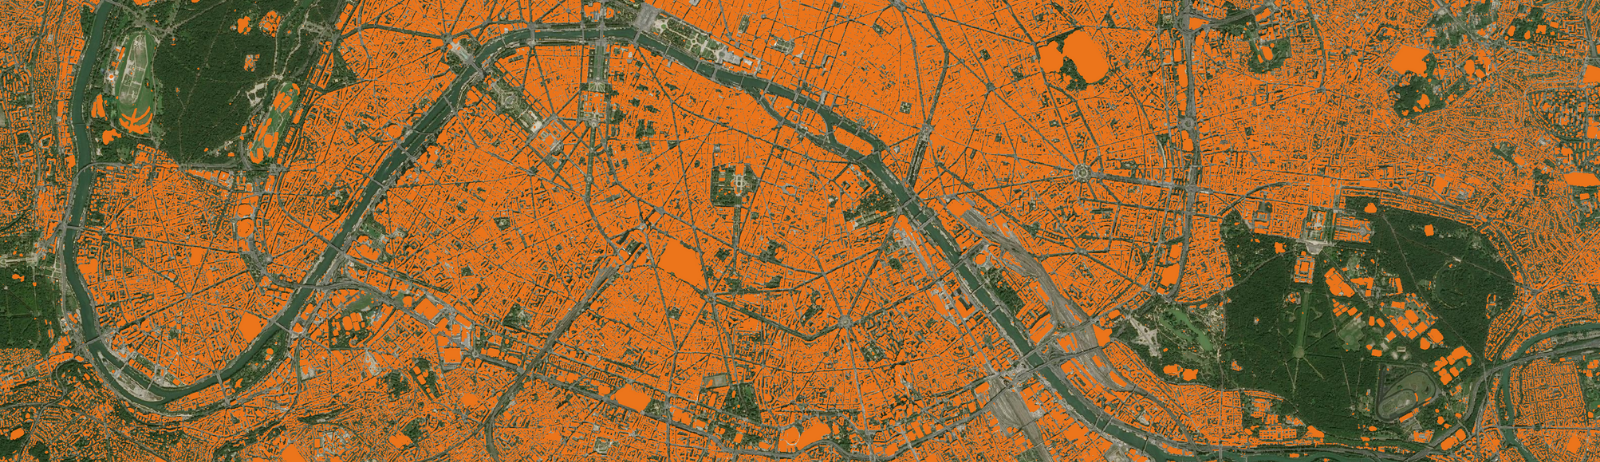
Theia Urban Scientific Expertise Center proposes the product “Buildings Footprint” on the entire France mainland, with a spatial resolution of 1.5m. It will be generated each year from very high-resolution remote sensing images from Spot-6 and Spot-7 satellites, distributed by the THEIA land data center through the GEOSUD/DINAMIS portal.
The product is obtained from image processing with a deep artificial neural network, trained from millions of Spot-6 and Spot-7 patches images, and the BDTOPO database from the French Geographical Institute.
All satellite images broadcasted by Geosud and acquired between 2015 and 2019 were used to train a unique model, able of classify any image on the France mainland area.
Mapping Data: © Airbus Defence and Space, IGN, INRAE, IRD
A deep learning based method
The TETIS team used a well-known deep learning technique called “semantic segmentation”. This technique consists in training an artificial convolutional neural network to classify every pixels of an image. The network developed was adapted to Spot-6 and Spot-7 images, which are composed of one panchromatic channel at 1.5 m spatial resolution, and four channels at 6 m spatial resolution (red, green, blue and near infrared).
The originality of this architecture resides in the way it processes the panchromatic and multispectral channels of Spot-6 and Spot-7 images: in a unified way, with two branches dedicated to both types of images, processed at their native resolution. The network merges the information extracted at both spatial scales, and estimates the classes at the same spatial resolution as the panchromatic image, i.e. at 1.5 m.
This has a double interest. First, Spot-6 and Spot-7 images can be processed directly, without pre-processing such as pan-sharpening. Such pre-processing is expensive in terms of computing time and storage. On the other hand, the network better preserves the information: indeed, pre-processing such as pan-sharpening can introduce distortions in the images, possibly degrading their quality and altering the original information.
To train and qualify this network, the team has collected several million Spot-6 and Spot-7 image samples on national coverage acquired between 2015 and 2019, and their correspondence in the BD TOPO provided by IGN.
The volume of these image samples represents less than 1.4% of a national coverage for the dataset used for training, and as much for the validation dataset. The team then trained the network. The validation dataset was used to compute the per-pixel precision metrics (confusion matrix, precision, recall, f-score) on each Spot-6 and Spot-7 scene. The team has published an entire chapter detailing the method [1]. All the tools to implement the method are open-source, based on the “OTBTF” extension [2] of the Orfeo ToolBox library [3], as well as the GDAL and TensorFlow libraries.
High performance computing is crucial
Processing large datasets requires the use of specific scientific computing hardware architectures.
In particular, deep learning benefits greatly from GPUs (Graphical Processing Unit), which enable massive parallelization of elementary operations.
In order to train the network, conduct the validation, and produce the maps, the TETIS team used the computing resources of the Jean-Zay computer installed at the Institute for Development and Resources in Intensive Scientific Computing.
Jean Zay is France’s most powerful supercomputer for research, acquired by the Ministry of Higher Education, Research and Innovation through the GENCI company (Grand équipement national de calcul intensif).
More than a thousand Spot-6 and Spot-7 scenes were processed with the network to produce maps of buildings at 1.5m spatial resolution over the entire France mainland.
Results
A validation dataset was used to measure the performance of the trained network on images not used during training.
The computation of a confusion matrix at pixel level between the buildings and non-buildings classes was conducted on each of the Spot-6 and Spot-7 scenes.
From this confusion matrix, the metrics traditionally used to qualify a classification were calculated.
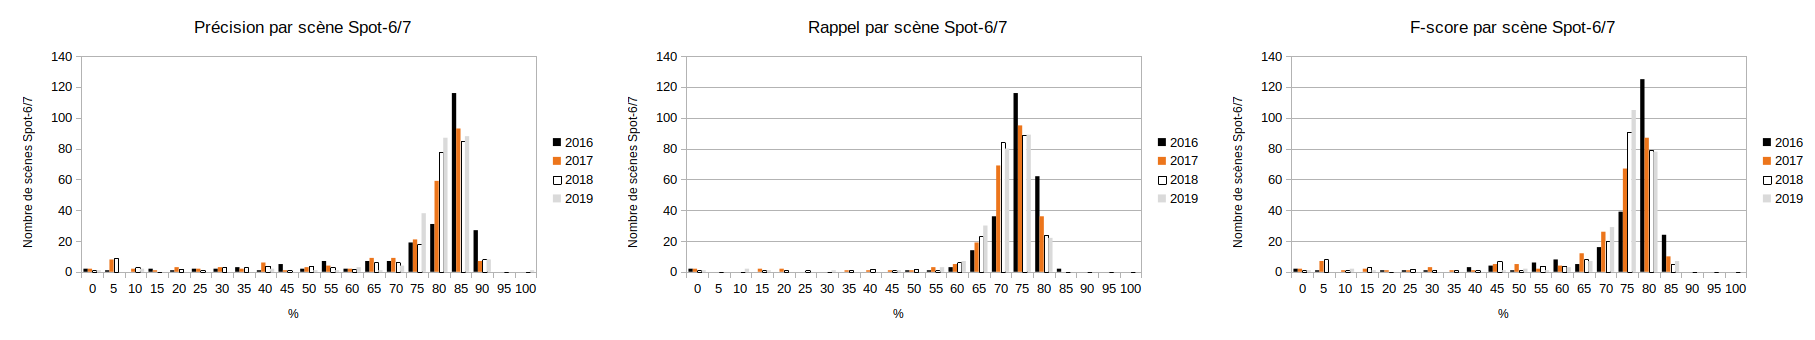
Precision, recall and f-score were thus obtained for each scene classification. The statistics of the metric values on all Spot-6/7 scenes are summarized below:
| Metrics | Mean value | Standard deviation | Median value |
|---|---|---|---|
| Précision | 73.1 % | +/- 18.2 % | 79.6 % |
| Recall | 68.8 % | +/- 10.0 % | 70.8 % |
| F-Score | 69.7 % | +/- 15.4 % | 74.4 % |
The figure below shows the distribution of the values of the different metrics computed per Spot-6 and Spot-7 scene.
Future perspectives
In the framework of the TOSCA project “Contribution of Multi-Sensor Satellite Imagery to address Environmental and Societal Issues of Urban Socio-Systems”, the TETIS team is interested in the distinction of different types of building use (e.g. residential, commercial or industrial, sports activities areas, etc.).
In the near future, the model will be used directly on Spot-6 and Spot-7 images from the DINAMIS system, and will supply the THEIA land data center with these products. In terms of research and development, the field of exploration remains vast: in addition to the technological and scientific exploration to carry out in deep learning, many questions emerge in the field of geomatics: how to better use ground truth data to train models, and to better qualify the results?
Contact

Rémi Cresson
INRAE | Tetis
@R.Cresson
Contributions
References
[1] Cresson, R. 2020, Part 3 Semantic segmentation, Deep Learning for Remote Sensing Images with Open Source Software. CRC Press, pp 67-83
[2] Cresson R., 2019, A framework for remote sensing images processing using deep learning techniques, IEEE Geoscience and Remote Sensing Letters Volume: 16, Issue: 1 , Jan. 2019 , pp 25 – 29.
[3] Grizonnet, M., Michel, J., Poughon, V., Inglada, J., Savinaud, M., & Cresson, R. (2017). Orfeo ToolBox: open source processing of remote sensing images. Open Geospatial Data, Software and Standards, 2(1), 1-8.