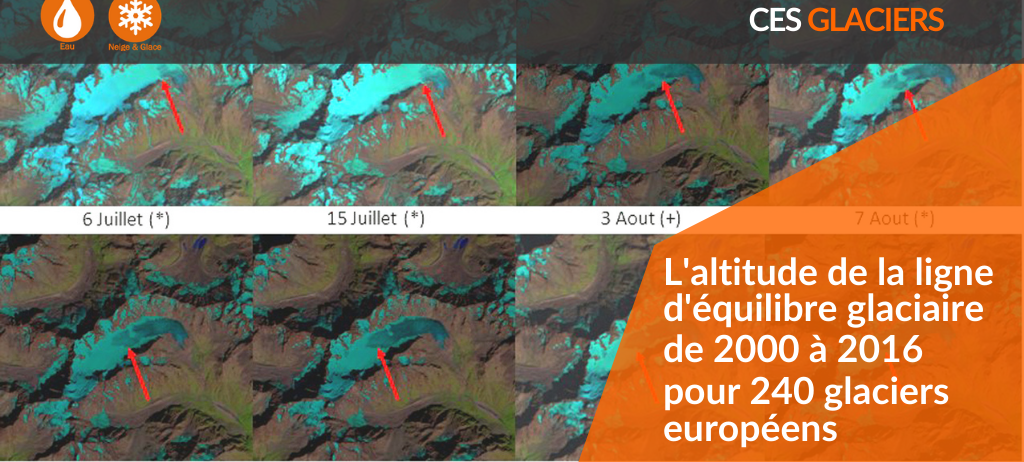
Glacier equilibrium-line altitude product: 240 Alpine glaciers now documented
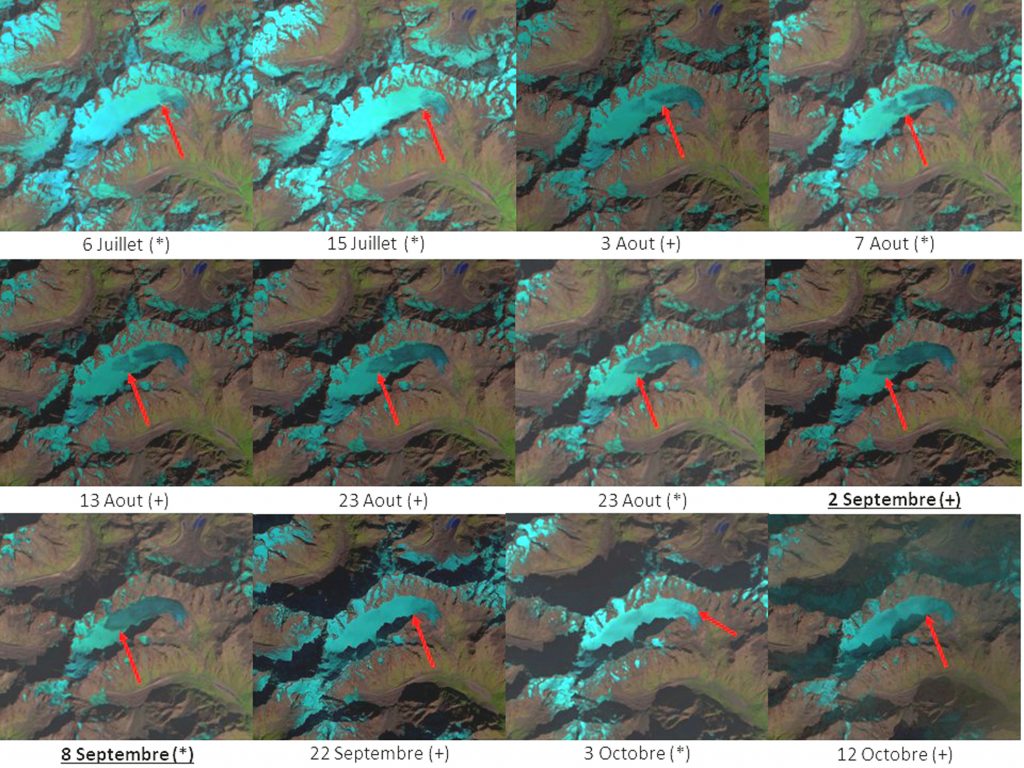
The glacier equilibrium line represents the place on the glacier where the surface mass balance is zero. It thus delineates, upstream, the accumulation zone (where the mass balance is positive) and, downstream, the ablation zone (where the mass balance is negative). From one year to the next, depending on climatic conditions, the altitude of the equilibrium line varies. Measuring its altitude each year and documenting its temporal variability therefore gives us information on climatic conditions and their evolution, as well as on the response of the glacier (mass gain or loss).
Traditionally and mainly due to the difficulty of access and the topographical complexity of glacial environments, glaciological data are derived from in situ measurements and are accessible on a very limited number of glaciers. Thus, in situ measurements of the equilibrium-line altitude are carried out on an extremely small number of glaciers: around 40 glaciers have continuous measurements over more than 40 years (i.e. 0.016% of the total number of glaciers on Earth).
To fill this gap, Theia Glaciers SEC has developed a product documenting by optical spatial remote-sensing the altitude of the annual glacier equilibrium-line, measured at the end of the ablation period, for all glaciers in the European Alps.
A product without equivalent
The product Annual Glacier Equilibrium-Line Altitude has no equivalent in Europe (Copernicus) or the United-States (NSIDC). One of its strengths is that it relies on both in situ observations and remote sensing. Finally, giving access to such a product is in line with the monitoring strategy established internationally by the Global Terrestrial Network for Glaciers (GTN-G) and the Global Cryosphere Watch (GCW, WMO).
From a scientific perspective, the product fills a gap in glacier information both nationally and internationally. In terms of applications, it provides elements for a better characterization of the recent evolution of glaciers and the associated impacts (water resources, sea level) useful for land management.
The characteristics of the annual Glacier equilibrium-line altitude product are the following:
- Satellite data sources: Sentinel-2, Landsat-5/8, ASTER, SPOT-6/7
- Frequency of publication: Annual
- Coverage: European Alps
240 glaciers in the European Alps
The product Annual Glacier Equilibrium-Line Altitude is available for a set of 240 glaciers in the European Alps over the period 2000-2016. The satellite data processing chain set up in the framework of Lucas Davaze’s PhD thesis (2019, Univ. Grenoble Alpes http://www.theses.fr/2019GREAU022) has been published (cf. Davaze et al. 2020, Supp. Mat.). Current considerations include the possibility of minimising human intervention in the production of the product and the production of the data.
We are looking forward to your feedback!