Presentation
THEIA group of experts in “Variables for Biodiversity” brings together a community of researchers and practitioners in remote sensing, ecology and botany, who participate in the development of methods and the production of images to improve the mapping and monitoring of biodiversity indicators.
This SEC relies on the expertise of research laboratories such as UMR TETIS (Montpellier), LETG (Rennes), CESBIO (Toulouse), DYNAFOR (Toulouse) as well as National Botanical Conservatories (Alpine CBN, Mediterranean CBN…).
Essential variables for biodiversity
Biodiversity is experiencing an unprecedented decline, as evidenced by the latest IPBES (Intergovernmental Platform on Biodiversity and Ecosystem Services) report published in spring 2019 (https://www.ipbes.net/news/Media-Release-Global-Assessment-Fr). More than one million plant and animal species are estimated to be threatened with extinction in the coming decades. The main factors responsible for this collapse are land use change, resource exploitation, climate change, pollution, and biological invasions.
In a perspective of operational monitoring of biodiversity on a large scale, the global scientific network GEO BON (Group on Earth Observations – Biodiversity Observation Network) has proposed a minimum set of indicators corresponding to EBVs – key biodiversity variables (Pereira et al. 2013). Several recent studies have shown the important potential of remote sensing to contribute to the monitoring of EBVs (Skidmore et al. 2015) and, more generally, to biodiversity monitoring (Gillespie et al. 2008; O’Connor et al. 2015; Jetz et al. 2016; Coops et al. 2018; Radeloff et al. 2019) with also the need to set a common framework to move forward (Pettorelli et al., 2016).
Satellite images offer a wide range of spectral indicators to estimate these EBVs, characterize habitat heterogeneity or predict the spatial distribution of species. The free or low-cost availability of satellite images with various spatial and temporal resolutions offers unprecedented prospects for monitoring the spatiotemporal dynamics of this biodiversity, whether plant or animal.
Thus, new remote sensing data should help to better characterize, at different scales, the distribution, floristic composition, phenology and functional traits of natural vegetation and the pressures exerted on it. Spectral indicators can also act as proxies for estimating wildlife diversity or ecosystem service levels. The identification of relevant spectral indicators and their use in an operational framework to predict and spatialize large-scale biodiversity indicators requires increased collaboration between remote sensors and ecologists.
Objectives
The objectives of THEIA group of experts in “Variables for Biodiversity” are the followings :
1 – Develop methods for characterizing and monitoring biodiversity from images at different spatial and temporal scales.
2 – Propose useful variables for monitoring biodiversity indicators. These variables may correspond to different vegetation indices but also to textural, diversity or seasonality indices. They will exploit both the spectral dimension of the images but also the spatial and temporal dimensions. The calculation of these variables does not always represent a methodological difficulty, but their systematic availability will facilitate their use and allow the decompartmentalization of communities.
3 – Responding to needs expressed by ecologists, by managers of natural areas or within the framework of public environmental policies.
4 – Strengthen interdisciplinary collaboration between remote sensing experts and biodiversity stakeholders (botanists, managers, ecologists, etc.) in order to promote the exchange of expertise and data needed to calibrate prediction models.
Proposed product
A first product is identified and will be tested and evaluated. This is the Dynamic Habitat index (DHI) based on annual Sentinel-2 time series.
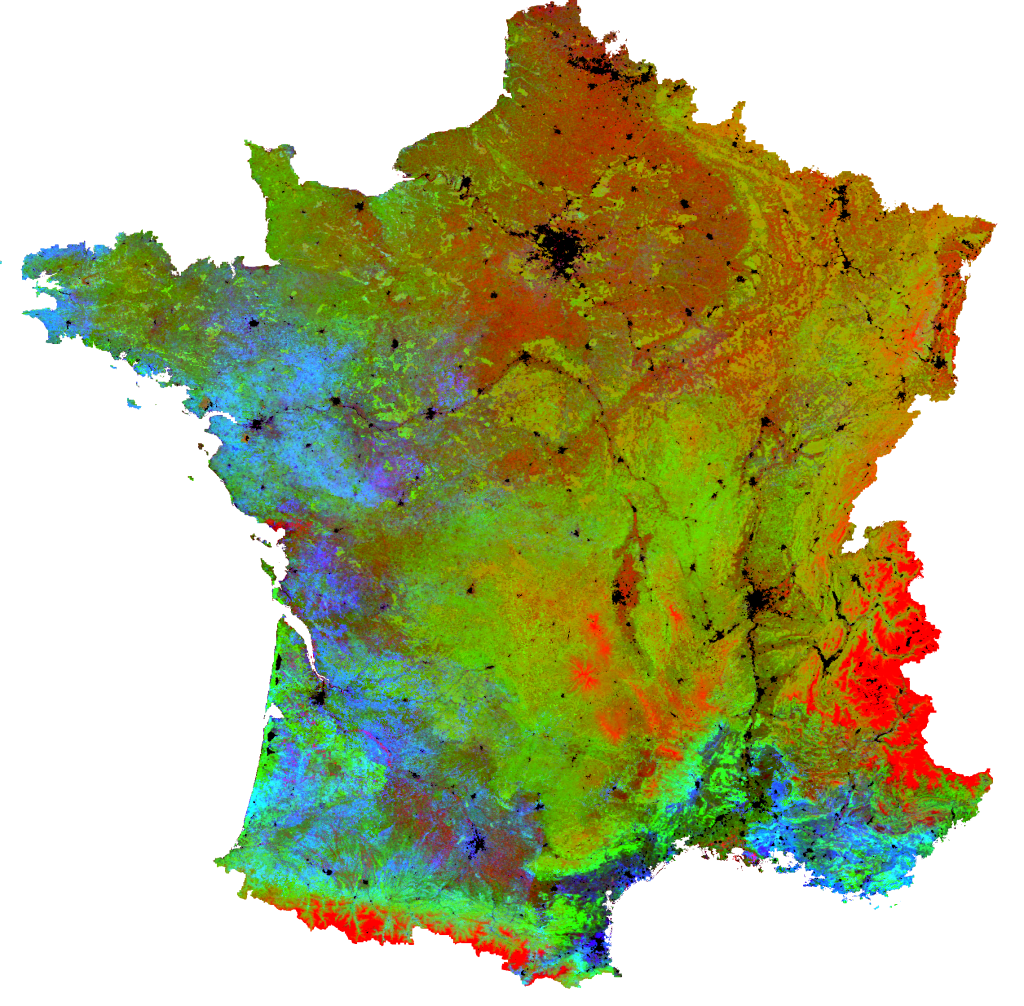
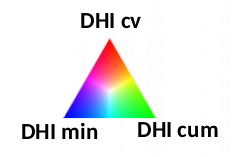
The DHI is designed to assess biodiversity and to describe natural habitats of different species. Three individual indices make up the DHI:
- Cumulative DHI- Cumulative DHI, i.e., the area under the phenological curve for a year.
- DHI min – minimum DHI, i.e. the minimum value of the phenological curve of a year.
- DHI var – seasonal DHI, i.e. the coefficient of variation of the phenological curve of a year.
Contact

David Sheeren
DYNAFOR
ResearchGate
Contributions FR
Main associated SECs
References
Citations
Coops, NC., Kearney, SP., Bolton, DK 2018. Remotely-sensed productivity clusters capture global biodiversity patterns, Scientific Reports, 8: 16261.
Gillespie T., Foody G., Rocchini D., Giorgi A. P., Saatchi S. 2008. Measuring and modelling biodiversity from space, Progress in Physical Geography, 32(2), pp. 203–221
Jetz W., Cavender-Bares J., Pavlick R., Schimel D., Davis F., Asner G.,… Ustin S. 2016. Monitoring plant functional diversity from space, Nature Plants, 2.
O’Connor, B., Secades, C., Penner, J., Sonnenschein, R., Skidmore, A., Burgess, N.D., and Hutton, J.M. (2015). Earth observation as a tool for tracking progress towards the Aichi Biodiversity Targets. Remote Sensing in Ecology and Conservation, 1, 19–28.
Pereira, H., Ferrier, S., Walters, M., Geller, G., Jongman, R., Scholes, R.,… Wegmann, M. 2013. Essential biodiversity variables. Science, 339 (6117), 277–278.
Pettorelli, N., Wegmann, M., Skidmore, A., Mücher, S., Dawson, T.P., Fernandez, M., Lucas, R., Schaepman, M.E., Wang, T., O’Connor, B., et al. (2016). Framing the concept of satellite remote sensing essential biodiversity variables: challenges and future directions. Remote Sensing in Ecology and Conservation 2, 122–131.
Radeloff V.C., Dubinin M., Coops N.C., Allen A.M., Brooks T.M., Clayton M.K., Costa G.C., Graham C.H., Helmers D.P., Ives A.R., Kolesov D., Pidgeon A.M., Rapacciuolo G., Razenkova E., Suttidate N., Young B.E., Zhu L., Hobi M.L. 2019. The Dynamic Habitat Indices (DHIs) from MODIS and global biodiversity, Remote Sensing of Environment, 222, pp. 204-214.
Skidmore, A.K., Pettorelli, N., Coops, N.C., Geller, G.N., Hansen, M., Lucas, R., Mücher, C.A., O’Connor, B., Paganini, M., Pereira, H.M., et al. (2015). Environmental science: Agree on biodiversity metrics to track from space. Nature, 523, 403–405.
SEC laboratories’ references
Bonthoux S., Lefèvre S., Herrault P.-A., Sheeren D. 2018. Spatial and Temporal Dependency of NDVI Satellite Imagery in Predicting Bird Diversity over France. Remote Sensing, 10(7), 1136.
Cano. E., Denux J.-P., Bisquert M., Hubert-Moy L., Chéret V. 2017. Improved forest-cover mapping based on MODIS time series and landscape stratification, International Journal of Remote Sensing, 38(7), pp. 1865-1888.
Corbane, C., Lang, S., Pipkins, K., Alleaume, S., Deshayes, M., García Millán, V.E., Strasser, T., Vanden Borre, J., Spanhove, T., and Förster, M. 2015. Remote sensing for mapping natural habitats and their conservation status – New opportunities and challenges. International Journal of Applied Earth Observation and Geoinformation, 37, 7–16.
Fauvel M., Arbelot B. , Benediktsson J.A. , Sheeren D. , Chanussot J. 2013. Hedges detection in a rural environment using local orientation feature: from linear opening to path opening. IEEE Journal of Selected Topics in Applied Earth Observations and Remote Sensing, 6(1), pp. 15-26.
Fauvel M., Planque C., Sheeren D., Dalla Mura M. 2014. Télédétection des éléments semi-naturels : utilisation des données Pléiades pour la détection des haies. Revue Française de Photogrammétrie et Télédétection, 208, pp. 111-116, 2014.
Lang, M., Alleaume, S., Luque, S., Baghdadi, N., and Féret, J.-B. (2018). Monitoring and Characterizing Heterogeneous Mediterranean Landscapes with Continuous Textural Indices Based on VHSR Imagery. Remote Sensing, 10, 868.
Lopes, M., Fauvel M., Ouin A. and Girard S. 2017. Spectro-temporal Heterogeneity Measures from Dense High Spatial Resolution Satellite Image Time Series: Application to grassland species diversity estimation. Remote Sensing, 9(7) :688.
Lopes, M., Fauvel M., Girard S., and Sheeren D. 2017. Object-based classification of grasslands from high resolution satellite image time series using gaussian mean map kernels. Remote Sensing, 9(7) :688.
Rapinel, S., Hubert-Moy, L., and Clément, B. 2015. Combined use of LiDAR data and multispectral earth observation imagery for wetland habitat mapping. International Journal of Applied Earth Observation and Geoinformation, 37, 56–64.
Rapinel, S., Dusseux, P., Bouzillé, J.-B., Bonis, A., Lalanne, A., and Hubert-Moy, L. 2018. Structural and functional mapping of geosigmeta in Atlantic coastal marshes (France) using a satellite time series. Plant Biosystems – An International Journal Dealing with All Aspects of Plant Biology 1–8.
Sausse C., Chéret V., Coffion R., Ducrot D., Duthoit S., Gross H., Lepennetier A., Manneville V., Sculo R., Sheeren D., Tosser V., Wartelle R. 2018. La télédétection des infrastructures agro-écologiques : de la promesse aux méthodes opérationnelles (Tél-IAE). Innovations Agronomiques, 63, pp. 267-278.
Sheeren D., Bastin N., Ouin A., Ladet S., Balent G., Lacombe J.-P. 2009. Discriminating small wooded elements in rural landscape from aerial photography: a hybrid pixel/object-based analysis approach. International Journal of Remote Sensing, 30(19), pp. 4979-4990.
Sheeren D., Masse A., Ducrot D., Fauvel M., Collart F., May S. 2012. La télédétection pour la cartographie de la trame verte en milieu agricole. Evaluation des potentialités d’images multi-angulaires à très haute résolution spatiale. Revue Internationale de Géomatique, 22(4), pp. 539-563.
Sheeren D., Bonthoux S., Balent G. 2014. Modeling bird communities using unclassified remote sensing imagery: effects of the spatial resolution and data period. Ecological Indicators, 43, pp. 69-82.
Sheeren D., Fauvel M., Josipovic V., Lopes M., Planque C., Willm J., Dejoux, J.-F. 2016. Tree Species Classification in Temperate Forests Using Formosat-2 Satellite Image Time Series. Remote Sensing, 8(9), 734, 2016.
Thierion, V., Alleaume, S., Jacqueminet, C., Vigneau, C., Michel, K., and Luque, S. 2014. The potential of Pléiades imagery for vegetation mapping: an example of grasslands and pastoral environments. Revue Française de Photogrammétrie et de Télédétection 105–110.